PSPL Exercises
Introduction
You can learn a great deal about a microlensing event from it’s lightcurve.
As we discussed in estimating parameters, you
can approximately measure the key parameters quite simply. These exercises
help to practise this technique.
Understanding the impact parameter
In the limit that u0 « 1, what is A(u)?
Example Events
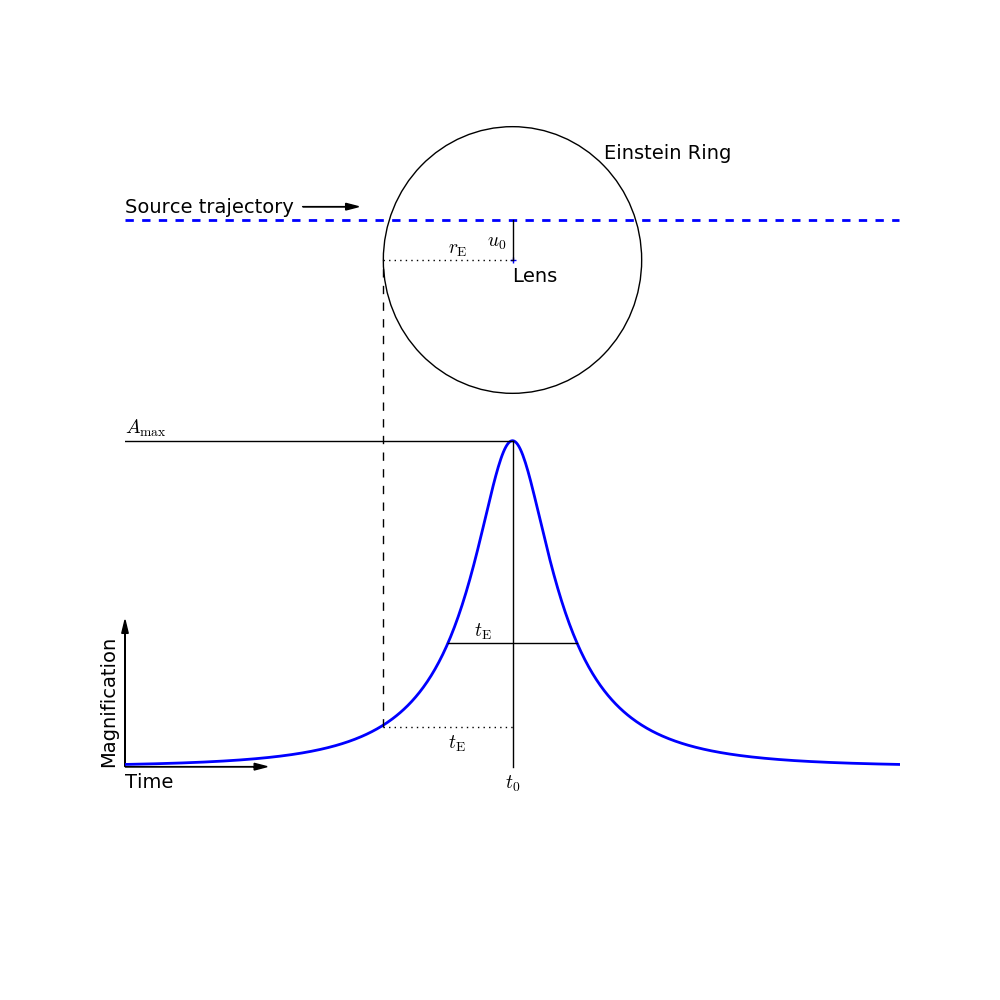
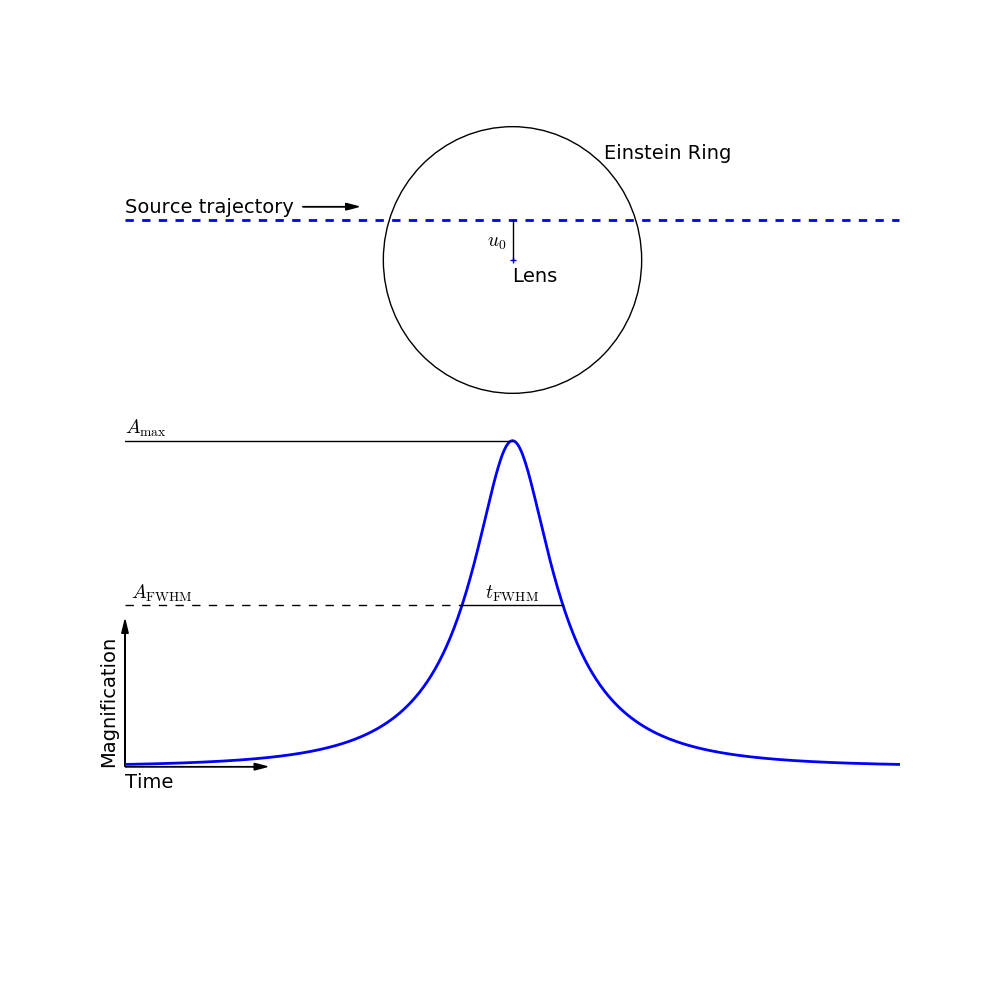
Below are discovery lightcurves of the first microlensing events. For each one, estimate its point lens parameters (t0, u0, tE). These basic parameters can be directly inferred from the lightcurve by measuring the height and time of the peak and tFWHM of the lightcurve (FWHM = Full Width Half Maximum). Then, tE can be calculated using the measured tFWHM and the above equations. In the limit where u0 « 1, tE ~ (1/2)tFWHM/u0.
|
|
The first MACHO event
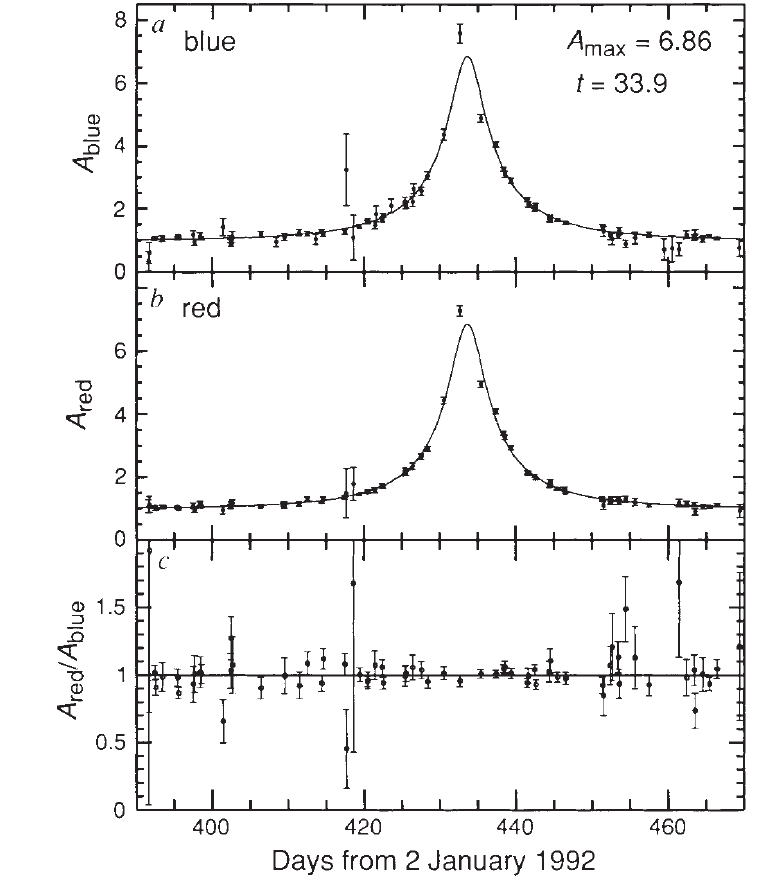
In 1993, the MACHO survey announced it’s first microlensing discovery in the paper
Alcock et al (1993).
Use their lightcurve (below) to estimate the main parameters for that event.
| Your answers | ||
|---|---|---|
| t0: | ||
| u0: | ||
| tE: |
The First EROS Events
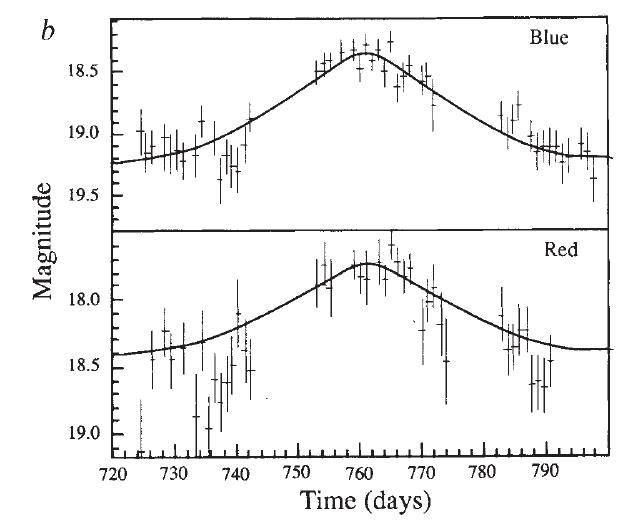
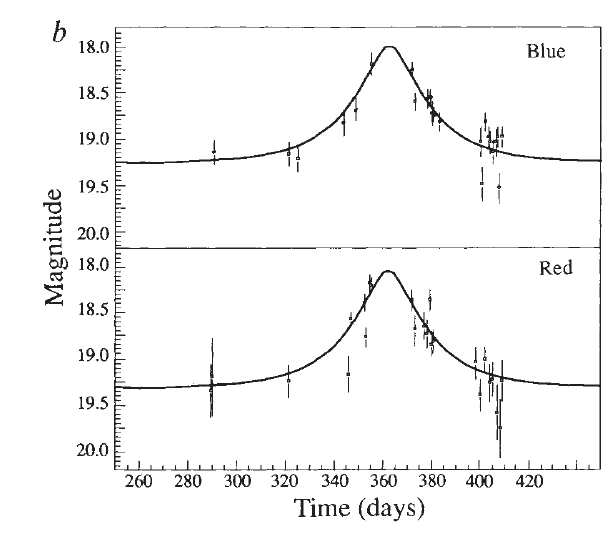
The EROS survey also published their first discoveries in 1993, in a paper by Aubourg et al. (1993). Estimate the parameters for these events from the lightcurves below.
| Your answers | ||
|---|---|---|
| t0: | ||
| u0: | ||
| tE: |
| Your answers | ||
|---|---|---|
| t0: | ||
| u0: | ||
| tE: |
Conclusions
In each of the examples shown above, there are two panels shown: red and blue. Why? Gravitational lensing is achromatic meaning that all light is magnified equally, regardless of wavelength. The fact that the lensing signal is the same in both bands is further proof that the observed light curves are caused by lensing rather than some other astrophysical effect. (For example, a stellar flare would look different in red and blue light.) The bottom panel of the first figure, Ared/Ablue, demonstrates that the signal is achromatic by showing that the ratio of the magnifications is flat.
References
Alcock, Akerlof, Allsman, et al. 1993 Nature, 365, 621
Aubourg, Bareyre, Bréhin, et al. 1993 Nature, 365, 623